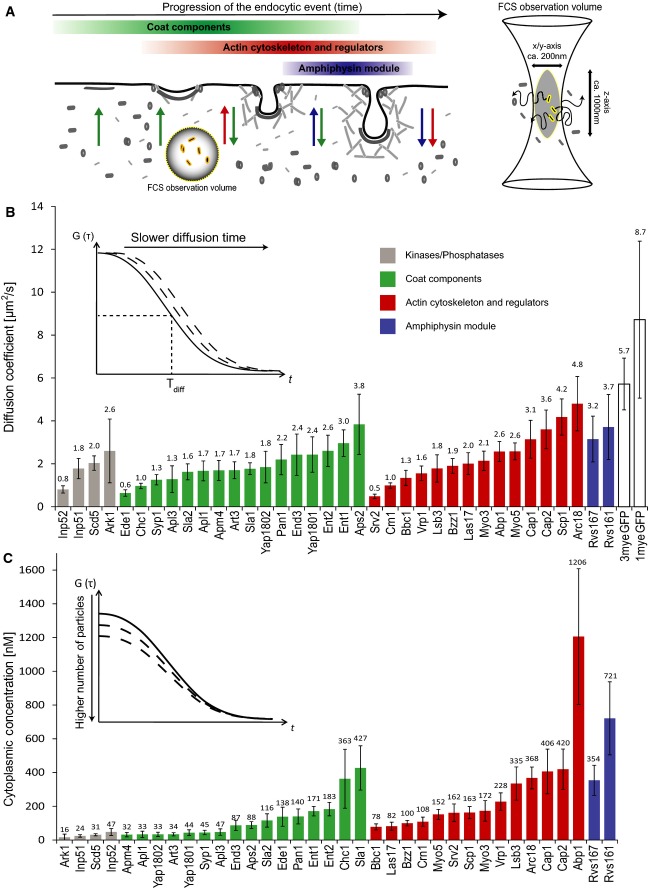
Figure 1. Cytoplasmic concentration and diffusion of endocytic proteins.
- Endocytic proteins are disassembled from the endocytic site or the maturing vesicle, released into the cytoplasm, and subsequently recruited to newly forming endocytic sites. The FCS/FCCS observation volume in this study is positioned in the cytoplasm of living yeast cells so that only the cytoplasmic pool of the fluorescently labeled proteins is investigated.
- Plot of the FCS-determined diffusion coefficients of labeled endocytic proteins, 1myeGFP, and 3myeGFP. Error bars represent the standard deviation derived from single cell measurements (Supplementary Table S1). The average diffusion time is calculated using the half-width of the autocorrelation curve. Proteins within a functional module are sorted from left to right according to their diffusion coefficient values. The color of the bars reflects the functional module that the respective protein belongs to (as indicated in A): green = coat components; red = actin cytoskeleton regulators; blue = amphiphysin module.
- Plot of the cytoplasmic concentration of endocytic proteins as quantified by FCS. Concentration is calculated using the amplitude of the autocorrelation curve. Error bars represent the standard deviation. Color scheme of the bars is the same as in (B). For details, see also Supplementary Table S1.

