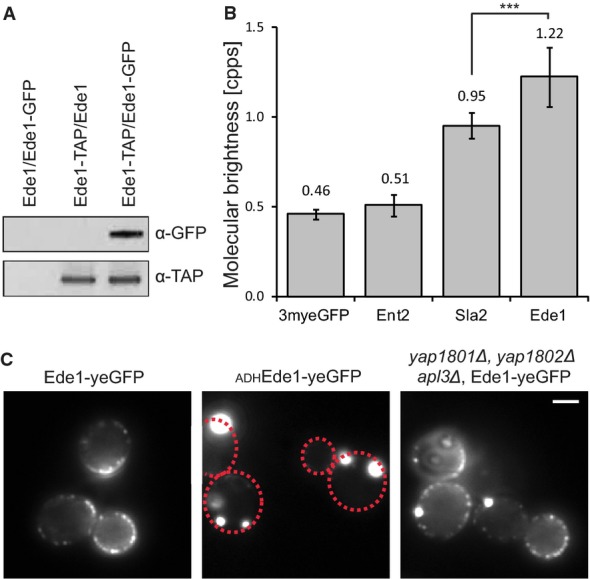
Figure 3. Cytoplasmic oligomers of Ede1.

- Tandem affinity purification of a diploid Ede1-TAP/Ede1-GFP strain. Purified proteins were subject to SDS–PAGE and were immunoblotted with α-GFP to detect Ede1-GFP and α-TAP to detect Ede1-TAP.
- Average photon counts per particle per second, measured in 11–14 individual cells per strain. Error bars represent the standard deviation (***P-value ≤ 0.001).
- Fluorescence images of Ede1-yeGFP expressed from its endogenous promoter (left), Ede1-yeGFP expressed from the ADH promoter (middle), and endogenously expressed Ede1-yeGFP in a yap1801, yap1802Δ, and apl3Δ strain (right). Scale bar corresponds to 2 μm. Where needed, dashed red lines were used to outline the cell boundaries.
