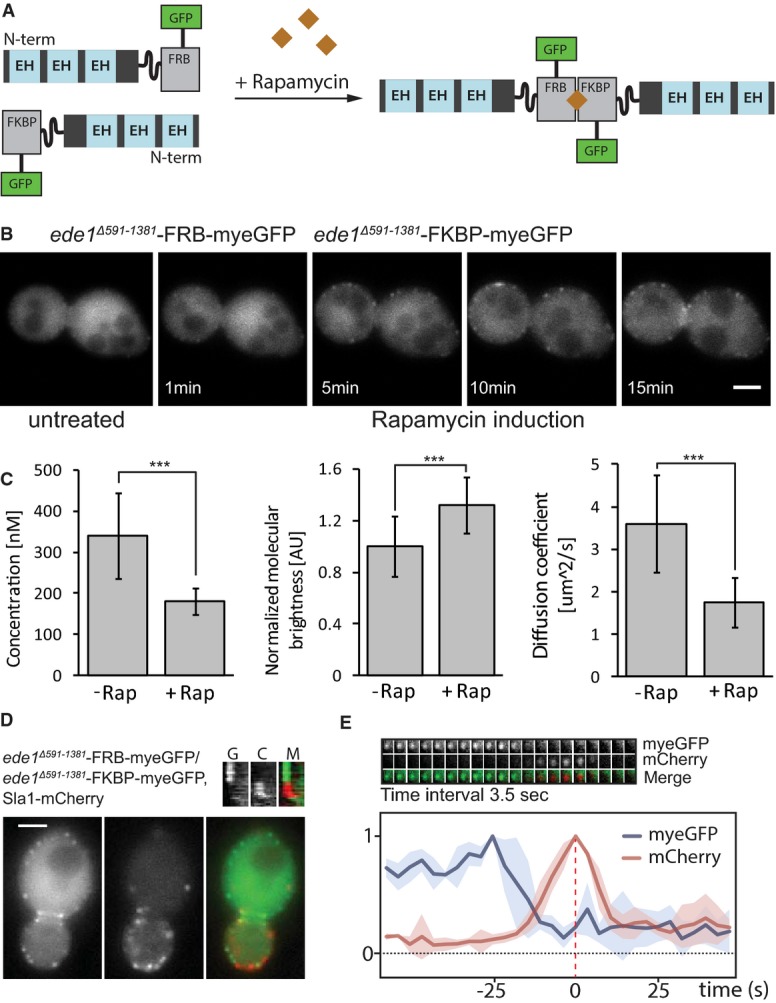
Figure 6. Artificial dimerization of ede1 mutants rescues its localization.

- Schematic representation of the artificial dimerization of ede1Δ591–1381 mutants by rapamycin.
- Time-lapse microscopy of an ede1Δ591–1381-FRB-myeGFP/ede1Δ591–1381-FKBP-myeGFP strain before and after rapamycin treatment. Scale bar corresponds to 2 μm.
- Quantification of the cytoplasmic concentration, normalized brightness per particle per second, and diffusion coefficient for an ede1Δ591–1381-FRB-myeGFP/ede1Δ591–1381-FKBP-myeGFP strain before and 30 min after rapamycin treatment (***P-value ≤ 0.001).
- Green (left), red (middle), and merge (right) of ede1Δ591–1381-FRB-myeGFP/ede1Δ591–1381-FKBP-myeGFP, Sla1-1mCherry strain 30 min after rapamycin treatment. Scale bar corresponds to 2 μm.
- Top: Time series of a single cortical patch in the same strain 30 min after rapamycin treatment. Time interval between frames is 3.5 s. Bottom: Quantification of the myeGFP and mCherry fluorescence in this strain for four patches plotted as a function of time. Individual intensity curves for myeGFP (blue) and mCherry (red) were normalized independently. For each patch, the myeGFP and mCherry curves were aligned to the peak intensity of Sla1 (= time point 0) in time.
