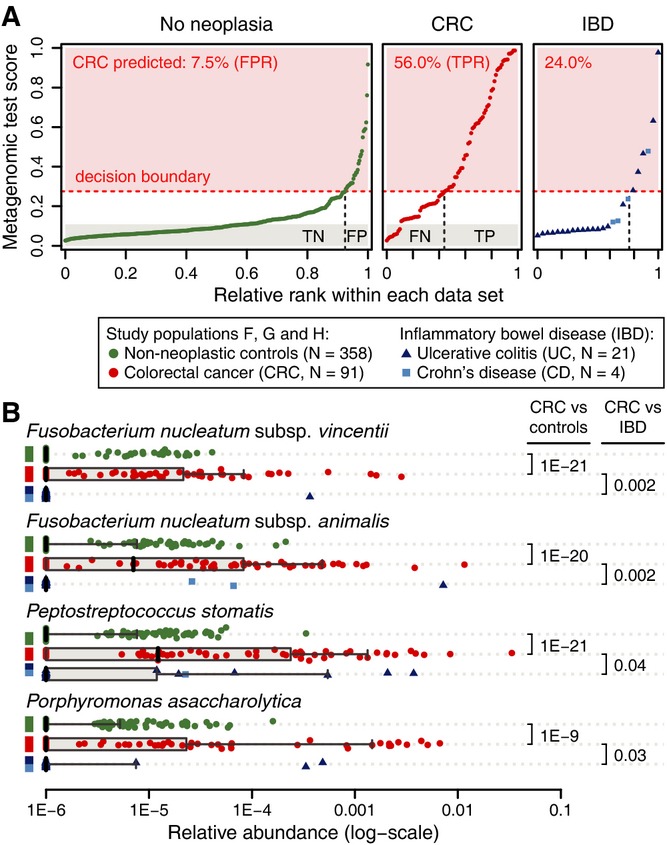
Ranked predictions of the metagenomic classifier (mean test prediction for study populations F, G
and H) are plotted for each individual (labels on top indicate grouping) with the percentage of
positive CRC predictions annotated in red. Proportions of true negatives (TN), false positives (FP),
false negatives (FN), and true positives (TP) are shown at the bottom for a decision boundary of
0.275 (see Fig
1). Application of the CRC classifier to
metagenomes from ulcerative colitis (UC) and Crohn's disease (CD) patients indicates a
threefold increased false-positive rate for inflammatory bowel disease (IBD) patients, suggesting
some similarities between CRC and IBD.