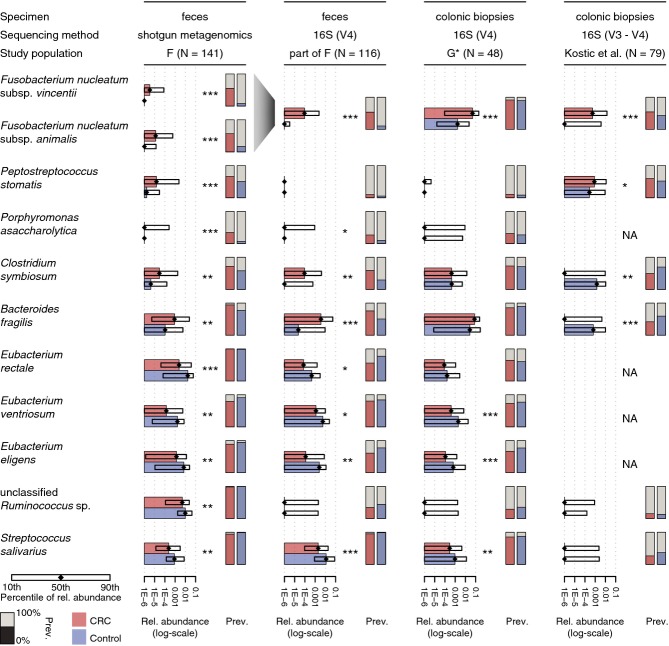
Figure 3. Consistency of CRC marker species abundances in fecal metagenomes and 16S rRNA profiles of tumor biopsies.
Horizontal bars indicate changes in median relative abundance (rel. abundance) of the CRC marker species (as in Fig 1A) that significantly differed between CRC patients and tumor-free controls (excluding large adenomas; all nominal P-values < 0.005, Wilcoxon test, see also Supplementary Fig S9). These are compared to 16S OTU abundances from a subset of fecal samples from study population F as well as to two groups of patients in which microbial communities on tumor biopsies and healthy colonic mucosa were profiled and compared (of the 48 patients in study population G*, 13 are part of study population G, see also Kostic et al (2012)). Boxes denote the interval between the 10th and 90th percentile of relative abundance. Metagenomic marker species were matched to 16S OTUs using a best-hit approach for the amplified 16S rRNA gene regions (NA, not matched, see Methods), both Fusobacterium species were matched to the same 16S OTUs. Significance was assessed by unpaired and paired Wilcoxon tests for fecal and biopsy datasets, respectively (*nominal P-value < 0.05, **P-value < 0.005, ***P-value < 0.0005). Note that for the majority of the species shown, the significance for distinguishing CRC patients from controls is higher (lower P-value) in metagenomic than 16S readouts. Vertical bars display the prevalence (prev.) of CRC marker species per patient/sample group (percentage of individuals in which these species/OTUs were detected with a relative abundance exceeding 1E-5).

