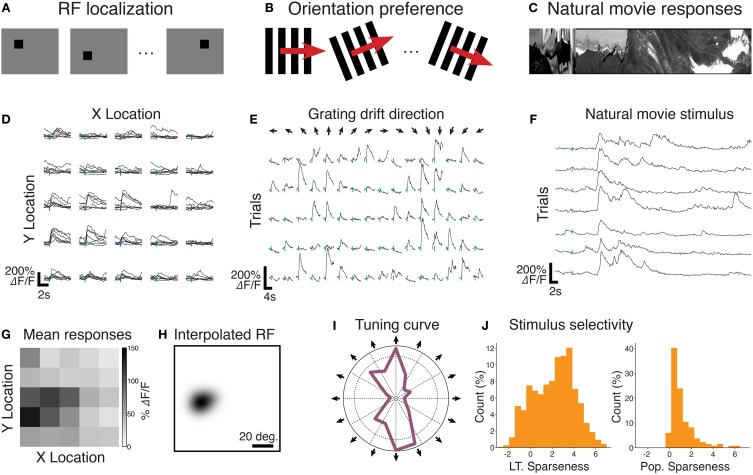
Figure 6.
Example analyses conducted with FocusStack and StimServer from recordings made in mouse V1. (A) An RF localization experiment, where a sparse random stimulus is presented over a 5×5 mesh. (B) Measuring preferred orientation using drifting gratings. (C) Recording single-neuron and population responses to natural movie stimuli. (D) Single-trial single-neuron calcium responses to sparse noise stimuli. (E) Single-trial single-neuron responses to drifting high-contrast gratings. (F) Single-trial single-neuron calcium responses to a natural movie stimulus. (G) and (H) show the estimated RF location for the neuron shown in (D). (I) The trial-averaged direction tuning curve for the neuron shown in (E). (J) The population distribution of lifetime (L.T.) and population (Pop.) sparseness, from responses imaged simultaneously with the neuron shown in (F). Stimulus onset in all traces (D, E, F) is indicated by a vertical tick mark. Data provided by M. Roth.

