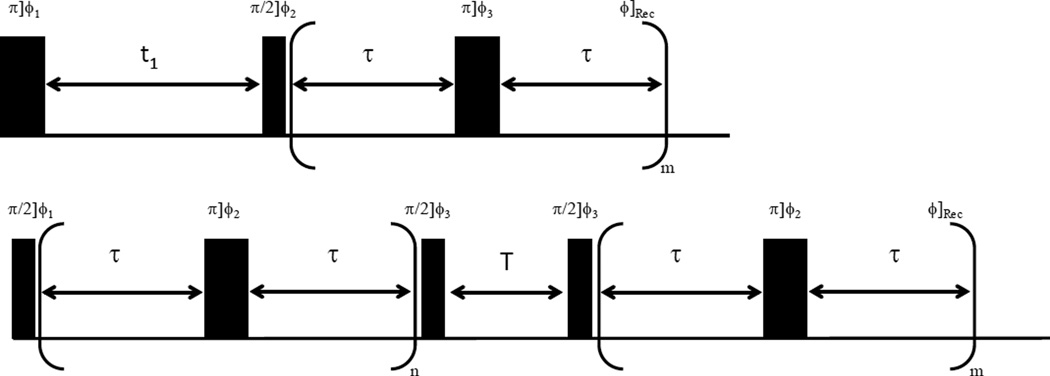
Figure 1.
Top) Radio frequency pulse sequence used for the 2D T1–T2 correlation experiments in this work; the phase cycling used was φ1 = {x, −x}, φ2 = {x, x, −x, −x}, and the receiver phase was φRec = {x, x, −x, −x}. In the experiment, the ω pulses where toggled as φ3 = {y,−y}. The details regarding the experimental values for m, t1 and τ are described in the text. Bottom) Radio frequency pulse sequence used for the 2D T2–T2 exchange measurements in this work; the phase cycling used was φ1 = {x, −x}, φ3 = {x, x, −x, −x} and the receiver phase was φRec = {x, −x}. The ω pulses were toggled using the phase scheme φ2 = {y, −y} and experimental values for time τ, the variables n and m, and the exchange time T are described in the text.

