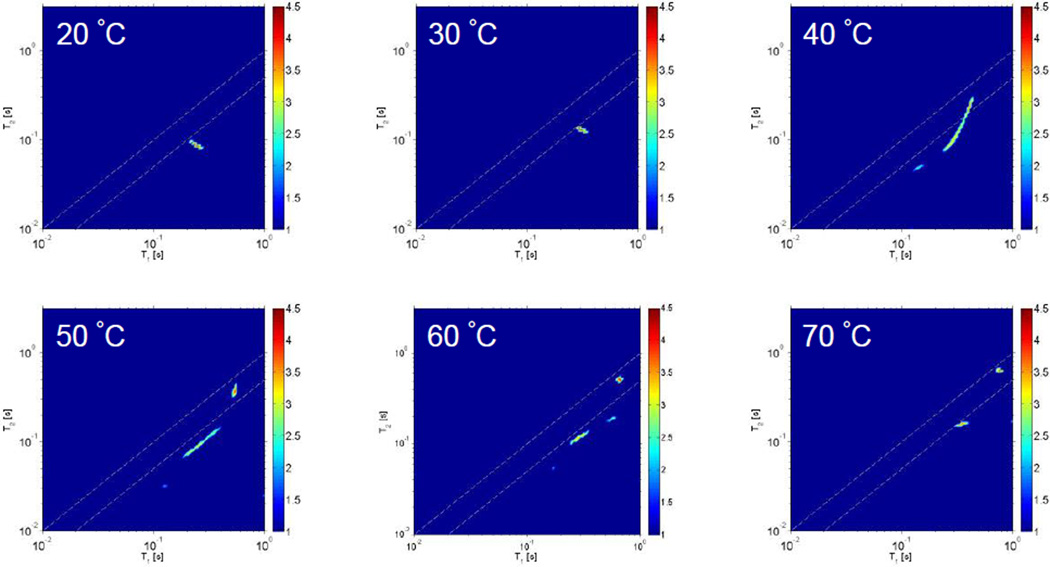
Figure 8.
Deuterium 2D T1–T2 ILT maps of PAD sample 2-B in D2O (10 wt%) as a function of temperature. The dashed lines in the images are intended to guide the eye for the region of the 2D map where T1 is approximately equal to T2. The signal intensity indicated by the color bar is on a logarithmic scale.

