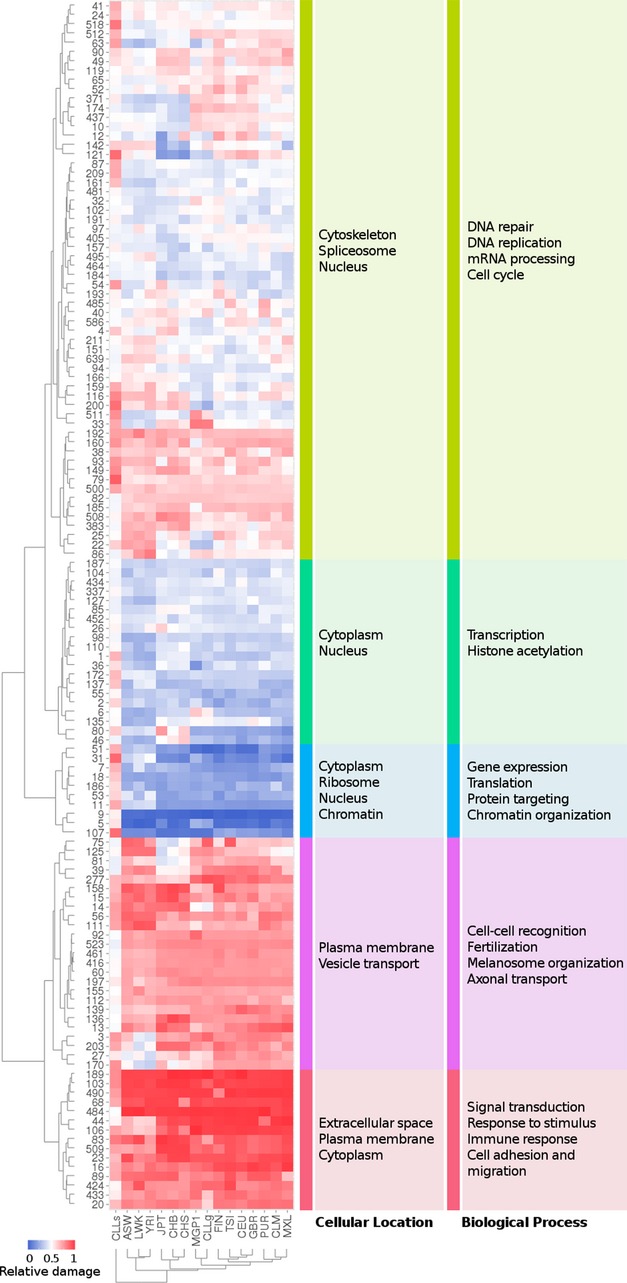
Figure 6. Heatmap depicting the distribution of the proteins harbouring deleterious variants in at least one allele across the interactome modules in the 1,000 genomes populations, the Spanish MGP1 population, germinal and somatic CLL.

Rows represent the different interactome modules defined by the Waltrap clustering algorithm, which are labelled with the corresponding identification number. The columns represent the populations analysed. The colour code represents the relative damage of the module, which accounts for the deviation in the proportion of affected proteins in the module from the random expectation distribution. Red indicates samples presenting more affected proteins than the random expectation, whereas blue indicates a negative difference. There are five main clusters defined by conventional hierarchical clustering using the Euclidean distances between the rows. On the right of the figure, the main GO terms which are significantly enriched in any of the mains clusters are displayed. The left column corresponds to cellular component ontology and the right column to the biological process ontology. When columns are clustered, the groups obtained according to the similarities in the distribution of affected proteins across modules correspond exactly to the geographical localization of the populations. The distribution of somatic deleterious mutations of CLL follows a pattern inverse to the rest of the normal populations. Source data are available online for this figure.
