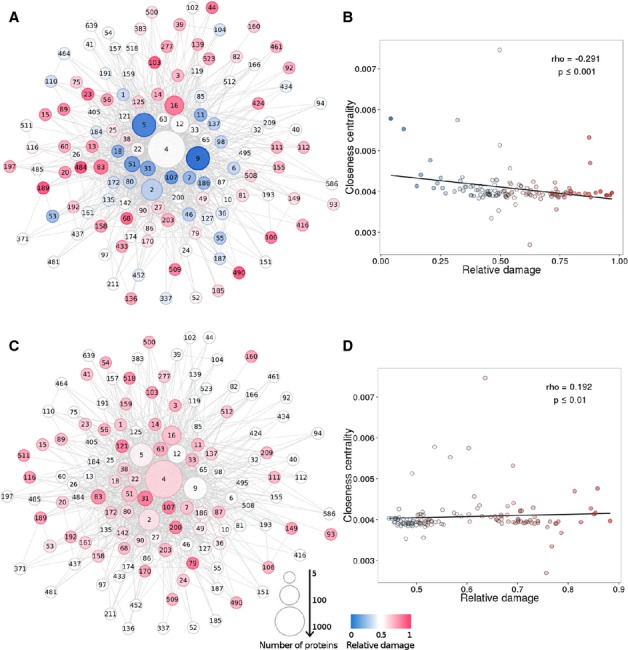
Figure 7. Interactome distribution of the deleterious variants in normal populations, and also within germinal and somatic variants in CLL patients.

Network of interactome modules as defined by the Walktrap clustering algorithm. Two modules are connected if there is at least one interaction between one of their respective proteins. The numbers in the nodes are the identifiers of each module. The size of the node is proportional to the number of proteins which it contains. The colour code represents the relative damage value. Relative damage values range between 0 (no proteins affected at all in this module) and 1 (the maximum possible number of proteins affected in this module). Blue indicates that the frequency of damaging variants is below the median in the simulated individuals (which would correspond to a value of 0.5), whereas red indicates that the value is above the median.
- Distribution of proteins with deleterious variants in the 1,078 individuals from the 1,000 genomes populations plus the 252 individuals in the MPG1 Spanish population and the 41 germinal CLL exomes across the interactome of modules.
- Closeness centrality, which gives a measurement on how central a node is (the higher, the more central) as a function of the relative damage of the module. There is a significant trend of accumulation of mutations as modules are more peripheral.
- Distribution of proteins with deleterious variants in the 41 somatic CLL exomes, representative of a pathological condition, across the interactome of modules.
- Closeness centrality as a function of the relative damage of the module for the 41 somatic CLL exomes. Opposite to the above, there is a significant trend of accumulation of mutations as modules are more central.
Source data are available online for this figure.
