
Figure 1. Overview on model domain, formed gradients, topological parameters, and biophysical parameters tested in the model.
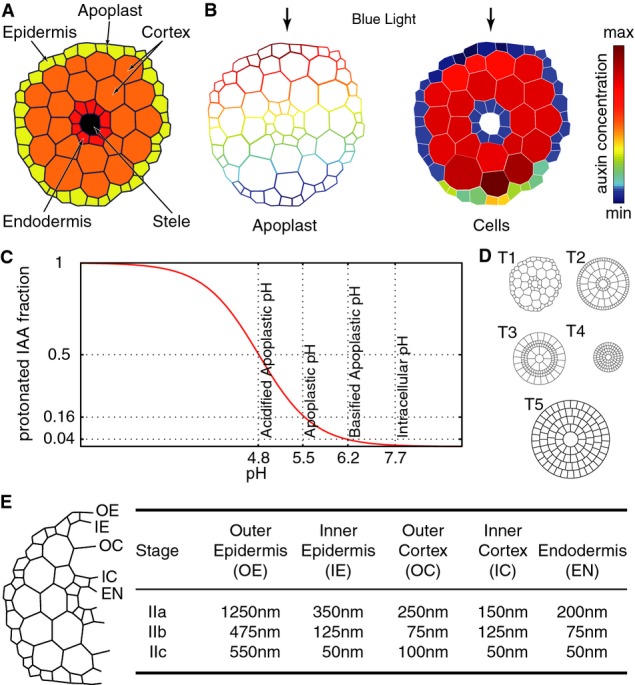
- Modeled domain representing a cross section through the elongation zone of a 3-day-old etiolated Arabidopsis thaliana seedling.
- Example of an auxin concentration gradient formed within a cross section showing apoplastic auxin gradient and cellular auxin gradient.
- Dissociation curve for IAA based on its pKa of 4.8 showing protonated fractions for different compartmental pH values.
- Different topologies tested during model parameter exploration: a realistic cross section (T1), a rotational symmetric cross section model with a cell size distribution over the different layers as found in the realistic cross section (T2), a rotational symmetric cross section model with an inverted cell size distribution (T3), and rotational symmetric cross section model where all cells have the same size (either small (T4)-like cells found in epi- and endodermis or big (T5)-like cells found in the cortex). Here, small cells have a diameter of approximately 15 μm, while big cells have a diameter of approximately 30 μm.
- Illustration of the exact localization of the different apoplast layers, outer epidermis (OE), inner epidermis (IE), outer cortex (OC), inner cortex (IC), and endodermis (EN) and their measured thicknesses for different elongation states as reported by Derbyshire and colleagues (Derbyshire et al, 2007).