
Fig. 3.
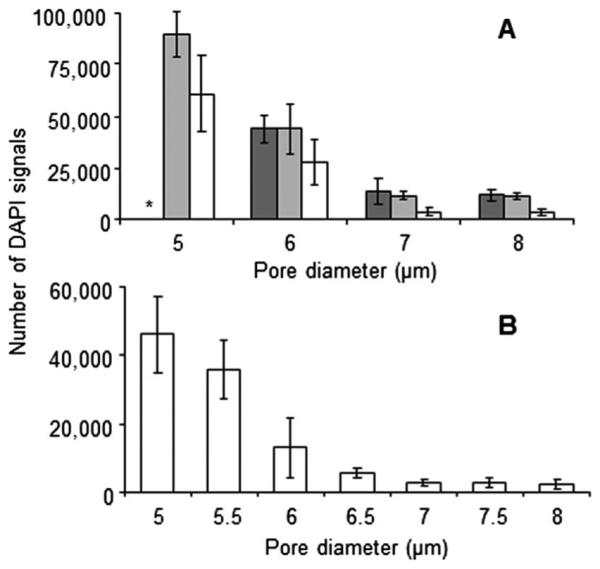
Blood cell contamination experiments. (A) DAPI contamination count after filtering whole human blood are compared using porosity microfilters of 70 000 (dark gray), 110 000 (light gray) or 160 000 (white). From a single blood donor, 7.5 mL whole blood with Prefixation Buffer is filtered, washed and mounted, with DAPI. A fluorescent microscope was used to count DAPI events (upper panel) (n = 5). *White blood cell plaque built up on filter. (B) The 160 000 microfilter design was tested with blood samples from healthy donors (n = 5). Pore diameters from 5–8 μm were compared (lower panel). A contamination plateau was seen at the ~7 μm pore diameter.