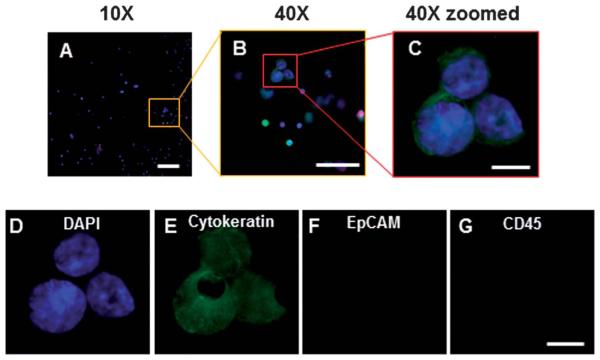
Fig. 6.
CTCs from a metastatic cancer patient can be identified after filtration. (A–C) Merged image of DAPI (blue), cytokeratin (green), EpCAM (red) and CD45 (magenta) on microfilter after filtration and immunofluorescent assay. CTCs can be easily identified by DAPI and cytokeratin stain presence (A) Under 10× magnification a representative image, from one of the 10 patient samples, of a CTC cluster can be seen by cytokeratin+, DAPI+, CD45-(scale bar,100 μm). (B) Under 40× magnification the CTC cluster can be easily seen and identified (scale bar, 50 μm). (C) Under 40× magnification and image enlarged, detailed cytological structures of the CTC cluster can be easily seen (scale bar, 10 μm). (D) DAPI (blue) and the abnormal chromatin pattern associated with cancerous cells are seen (scale bar, 10 μm). (E) Cytokeratin is identified with a filamentous stain pattern (scale bar, 10 μm). (F) EpCAM of these CTCs is either negative or below the threshold of the assay, antibody capture systems would likely not capture this cell (scale bar, 10 μm). (G) CD45 is negative in these CTCs, this is the standard negative control marker used for CTC identification (scale bar, 10 μm).

