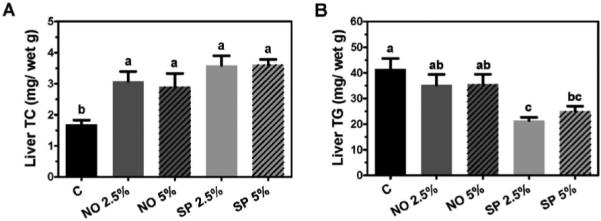
Figure 2.

Lipid contents of the livers of male C57BL/6J mice, which were fed an AIN-93G/M control or a BGA supplemented diet (2.5% and 5% for NO and SP, by weight) for 6 months. Hepatic TC (A) and TG (B) levels were measured and expressed mg/g of wet weight. Data are shown as means ± SEM. n = 7-8. Bars with a different letter are significantly different (P < 0.05).
