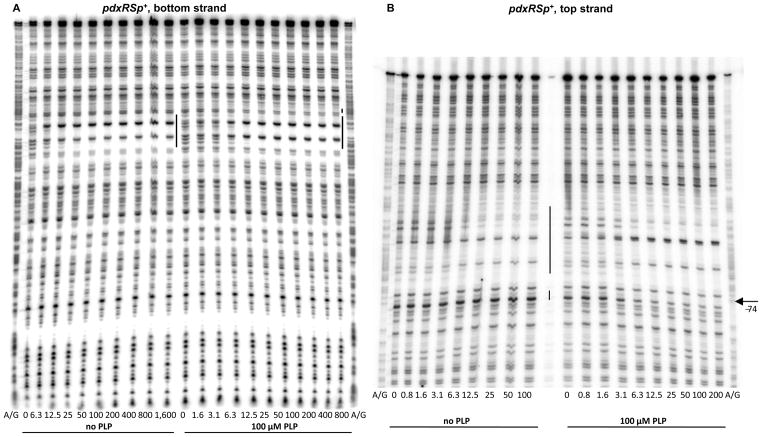
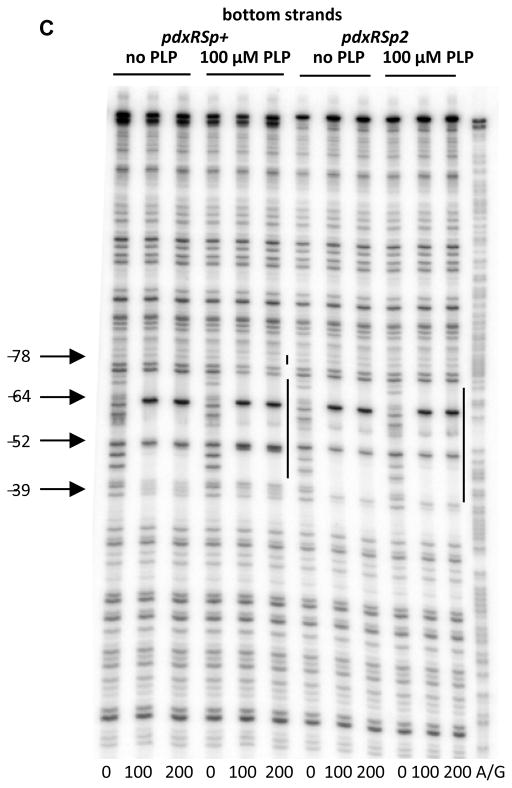
Fig. 4. DNase I footprinting analysis of PdxR binding to the pdxRS regulatory region.
pdxRSp+ (A, B, C) or pdxRSp2 (C) DNA fragments, radioactively labeled on the bottom (A, C) or top (B) strand, were incubated with increasing concentrations of purified PdxR and in the absence or presence of 100 μM PLP. PdxR monomer concentrations used (nM) are indicated below each lane. The corresponding A + G sequencing ladders are shown in the left and right lanes. The protected areas are indicated by the vertical lines. The positions of some bands (with respect to the +1 position of pdxS) are shown by arrows.


