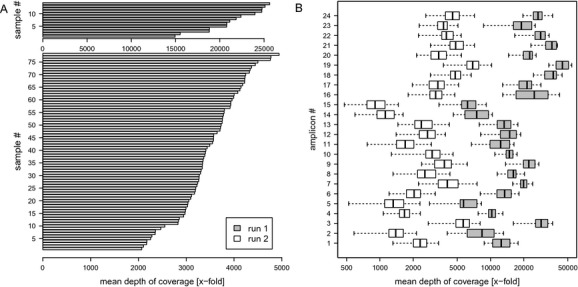
Figure 1.

Depth of coverage. Amplicon coverage achieved when multiplexing 14 samples (run 1) or 78 samples (run 2) per MiSeq run. (A) Theoretical average coverage (calculated for each sample as total number of reads × read length/total target length). (B) Distribution of observed amplicon coverage after read mapping, clipping of probe sequences, and quality filtering.
