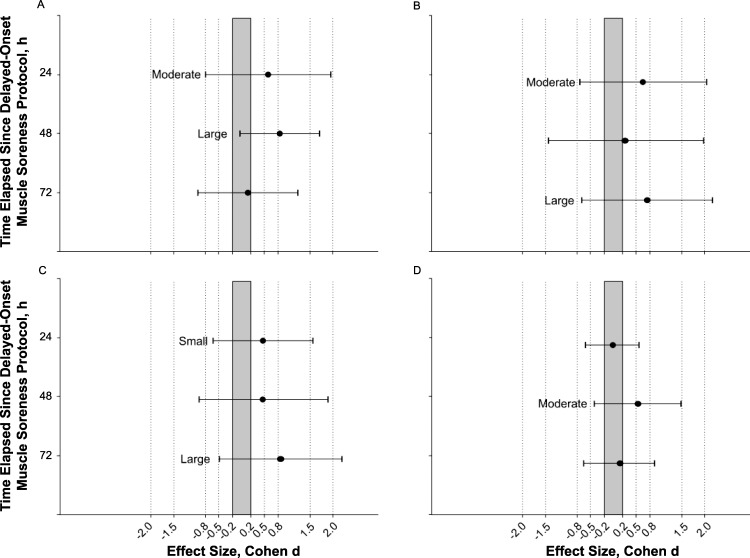
Figure 4.
Magnitude-based inferences demonstrating the effect of foam rolling on A, muscle tenderness, B, sprint speed (30-m sprint time), C, power (broad-jump distance), and D, dynamic strength-endurance (maximal squat repetitions with a 70% of 1-repetition maximum load) after the delayed-onset muscle soreness (DOMS) protocol. Points represent the effect size (Cohen d) describing the interaction effect of foam rolling to control between each time point and pre-DOMS protocol. Error bars represent 95% confidence limits for the mean effect. A point in the shaded region represents a clinically trivial effect.

