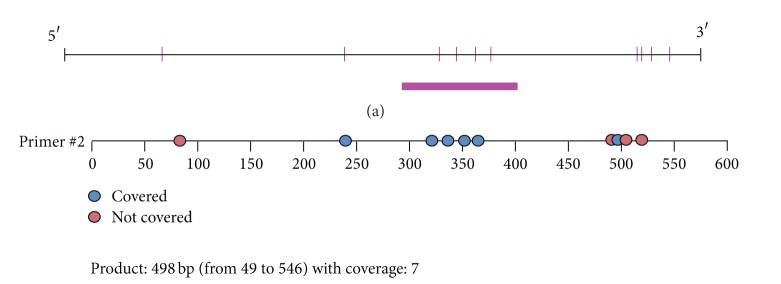
Figure 2.

Upstream sequence of ALDH2 core promoter. (a) The chart is the analysis result of Methyl Primer Express; red pillars stand for CpG sites, and bar underlying highlights CpG high density region; (b) another analysis in the same region; blue dots represent valid CpG sites while red dots are invalid which cannot be detected in MassARRAY. Valid dots were numbered.
