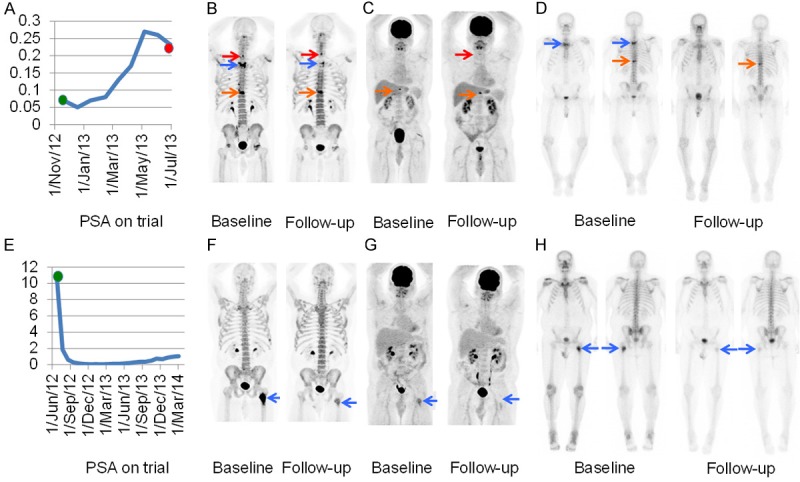
Figure 2.

Change in PSA (A), 18F-NaF-PET/CT (B), 18F-FDG-PET/CT (C) and 99mTc-MDP bone scan (D) at baseline and 8 week follow-up in a man with baseline oligometastatic 18F-FDG-avid disease, metabolic disease progression on 18F-FDG-PET/CT, mixed change on 18F-NaF-PET/CT and response on 99mTc-MDP bone scan following radiation from T1 to T4 prior to enrolling on the trial. Of note, the 99mTc-MDP bone scan performed after 6 months of therapy (not shown) suggested worsening disease similar to the 18F-FDG-PET/CT performed at 8 weeks. The red, blue and orange arrows depict the C7, T2 and T10 lesions. Change in PSA (E), 18F-NaF-PET/CT (F), 18F-FDG-PET/CT (G) and 99mTc-MDP bone scan (H) at baseline and 8 week follow-up in a man with baseline oligometastatic 18F-FDG-avid disease and metabolic disease response on 18F-FDG-PET/CT, 18F-NaF-PET/CT and 99mTc-MDP bone scan following radiation to the left femoral lesion (blue arrow) prior to enrolling on the trial.
