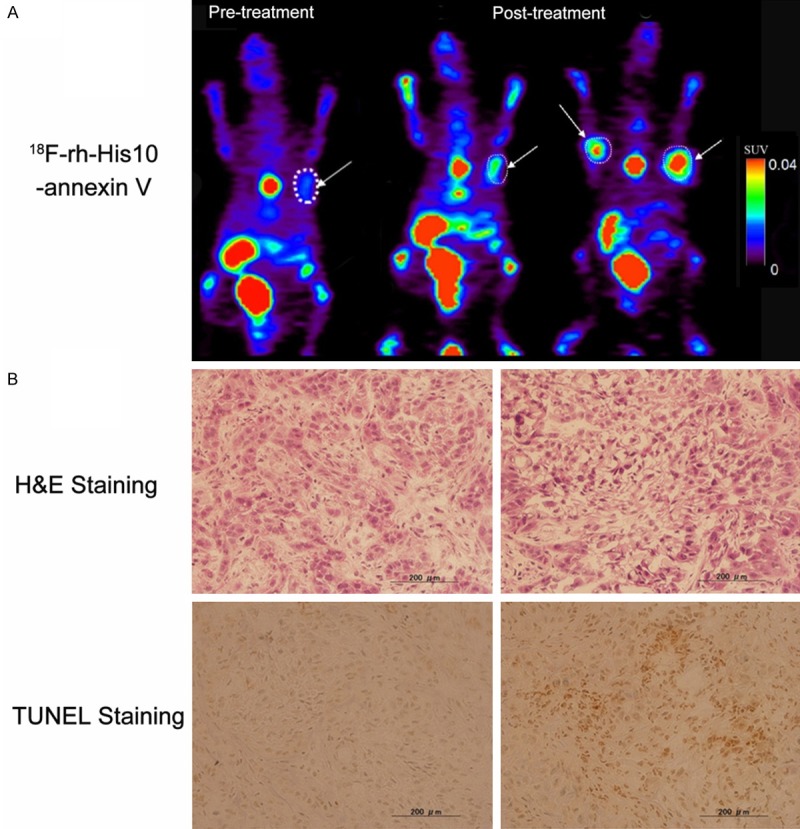
Figure 4.

Representative PET images of 18F-rh-His10-annexin V in A549 tumor model (A). Left: Image in the tumor before treatment, Middle and Right: after paclitaxel treatment (Middle, same xenegraft with before treatment, Right, another mouse xenograft). Histological staining (B): Much more apoptotic cells were presented in the tumor after treatment in comparison of baseline image. The tumor was indicated by white arrow.
