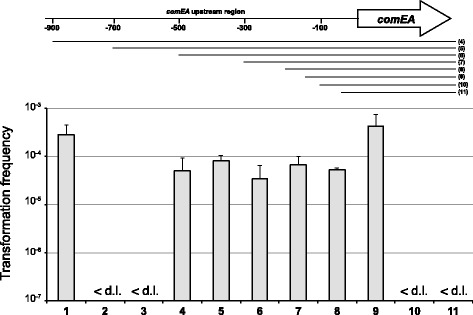
Figure 3.

Localization of the putative promoter region of comEA . Schematic representation of comEA with 900 bp of its upstream region (not to scale). To localize the promoter, the upstream region of comEA was incrementally shortened. The numbers indicate the bp upstream of the start codon of the open reading frame, which itself is indicated by the arrow. The cloned fragments are indicated by the lines below the genomic region view, and the numbers in the brackets on the right correspond to the lane numbers in the graph. Fragment lengths upstream of comEA (numbered 4–11): 900 bp, 700 bp, 500 bp, 300 bp, 203 bp, 134 bp, 100 bp, 40 bp. Graph: V. cholerae strains harboring the plasmid-encoded comEA plus the indicated upstream regions were tested for their transformability. The transformation assay was performed in a chitin-dependent manner, and the transformation frequencies of the strains are shown on the y-axis. Strains tested: wild-type A1552 (lane 1); ΔcomEA (lane 2); ΔcomEA/p (vector control; lane 3) and ΔcomEA containing plasmids according to the schematic above the graph (lanes 4–11). The data are the average of at least three independent experiments and the error bars reflect the standard deviation. <d.l.: below detection limit.
