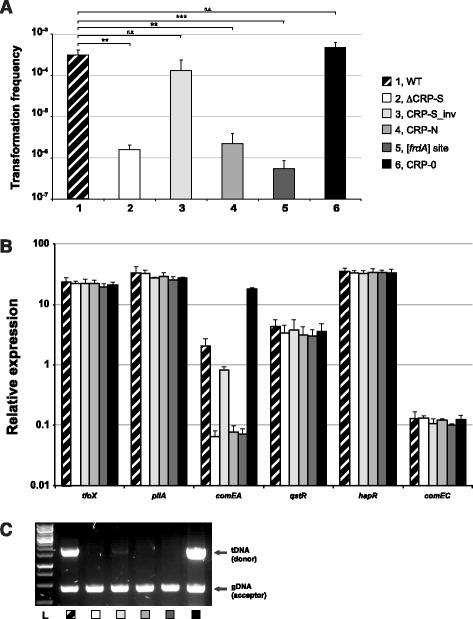
Figure 5.

Variants of the putative CRP-S motif preceding comEA are altered with respect to natural transformation. (A) Natural transformability of the indicated strains was tested under tfoX-inducing but chitin-independent conditions as previously described [10]. The frequencies are indicated on the Y-axis. Lane numbers are according to the legend shown on the right. The graph shows the average of at least three independent biological replicates (±SD as indicated by the error bar). Statistically significant differences were determined by Student’s t-tests. **P < 0.01, ***P < 0.001, n.s. = not significant. (B) The same strains used in panel A were tested for the relative expression of tfoX (arabinose-induced), pilA, comEA, qstR, hapR, and comEC. The values are given on the Y-axis. Data are averages from at least three independent experiments ± SD. (C) The ability of the wild-type and mutant V. cholerae strains to take up DNA was tested using a whole-cell duplex PCR assay. The lower fragments reflect the quantity of acceptor bacteria and serve as internal controls. The upper band indicates internalized transforming DNA (tDNA). L, ladder.
