
Figure 3.
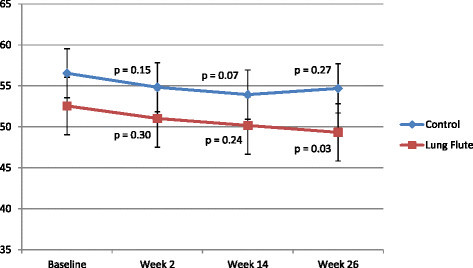
Change in the SGRQ score during the study in the two arms. The p values are for the change from baseline within each group.
Official websites use .gov
A
.gov website belongs to an official
government organization in the United States.
Secure .gov websites use HTTPS
A lock (
) or https:// means you've safely
connected to the .gov website. Share sensitive
information only on official, secure websites.
Change in the SGRQ score during the study in the two arms. The p values are for the change from baseline within each group.