Figure 1.
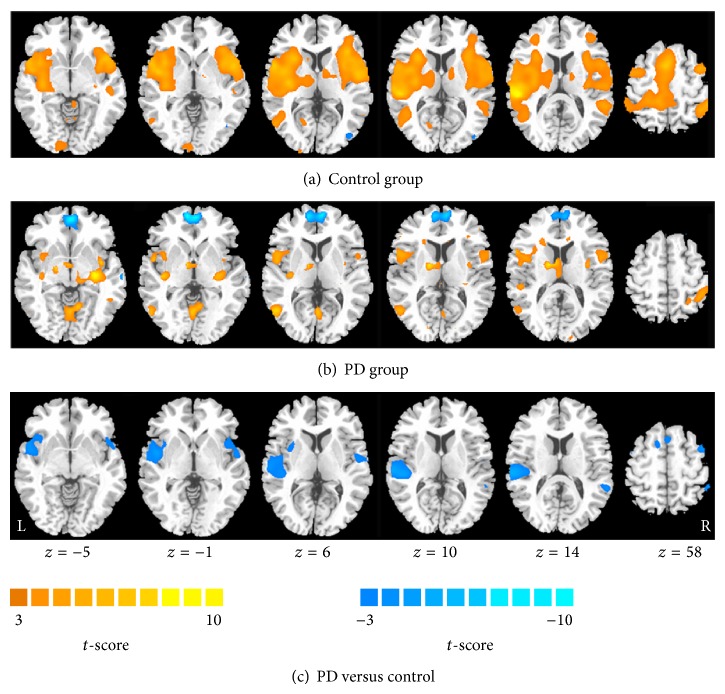
Within-group activation maps in response to heat stimulation in the control group (a) and the PD group (b). Activation is represented as hot and deactivation as cool. Row (c) shows the difference of activation between groups. Cool color represents the decreased activation in patients with PD in contrast to healthy controls.

