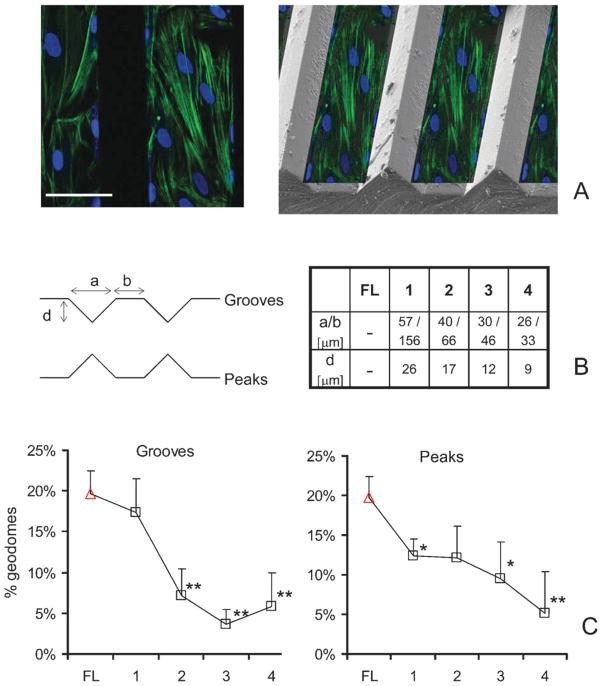
Fig. 4. Topographic control of geodesic domes.
Scaffolds were designed with grooves and peaks of the specified dimensions to create 3D landscapes. (A-left) Confocal cross-section of cells grown on a Peak-2 surface and stained for F-actin and nuclei; (A-right) a collage of the fluorescently labeled cross-section overlaid on an actual scanning electron microscopy (SEM) image of a scaffold with a peak-type of surface, to illustrate relative position. (B) Schematic diagram of groove and peak types of surface with their corresponding dimensions. (C) More structured anisotropy-enforcing surfaces reduce the number of geodesic domes, when compared to flat (FL) surfaces. Values are mean ± s.e.m. (*) indicates statistical significance at p < 0.05, and (**) at p < 0.01. Scale is 50 μm.

