
Figure 3.
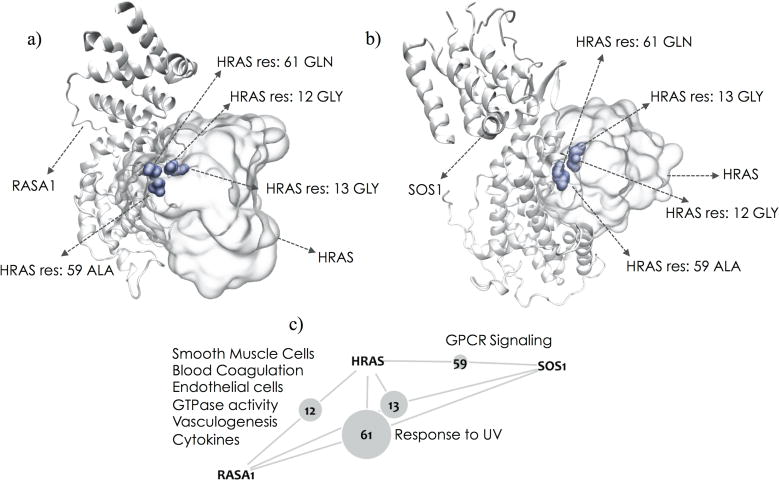
The RASA1–HRAS complex (a) and the SOS1–HRAS complex (b) show that both interactors utilize the same binding site on HRAS. Residues 12, 13, 59 and 61 on HRAS that participate in the interface region of these interactions are highlighted in blue. Residue 12 mediates the HRAS-RASA1, residue 59 mediates the HRAS-SOS1 interaction, and 13 and 61 participate in both interactions. The small network (c) provides a schematic of the residues mediating particular interactions. The grey nodes represent the residues. Their sizes are proportional to the frequency with which they are mutated in the TCGA cohort. Functions predicted to be specifically altered by mutations at each interface are listed on the edges.