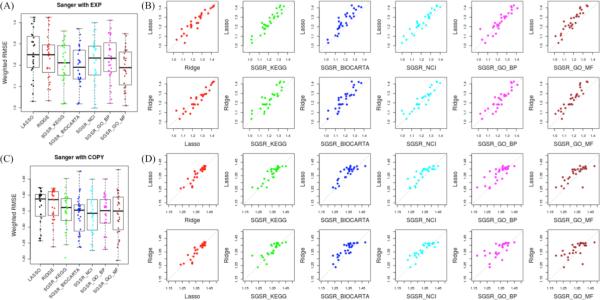
Figure 4.
Performance comparison for Sanger pharmacogenomics data. (A) Predictability score with WRMSE metric of LASSO, Ridge, SGSR with KEGG, Biocarta, NCI/Nature, GO-BP and GO-MF pathways using EXP data across the preselected 28 Sanger drugs; (B) Performance discrepancy between benchmarked LASSO, Ridge and SGSR models with five available pathway databases with EXP (C) Predictability score with WRMSE metric of LASSO, Ridge, SGSR with KEGG, Biocarta, NCI/Nature, GO-BP and GO-MF pathways using COPY data across the preselected 28 Sanger drugs, (D) Performance discrepancy between benchmarked LASSO and Ridge and SGSR models with five available pathway databases with COPY.

