
Fig 1.
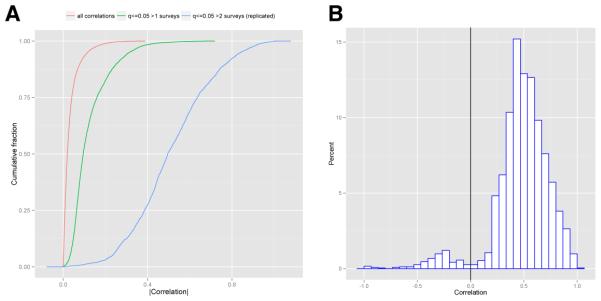
A.) Cumulative distribution of absolute value of correlations. The red line denotes the summarized correlation coefficients for all pairs of exposures possible. The green line denotes correlations that achieved q-value less than 5%. The blue line denotes correlations that were replicated (and part of the exposome globe), or had q-value less than 5% in at least 2 surveys. B.) Histogram of all replicated correlations of the exposome globe. Vertical black line denotes 0 correlation.