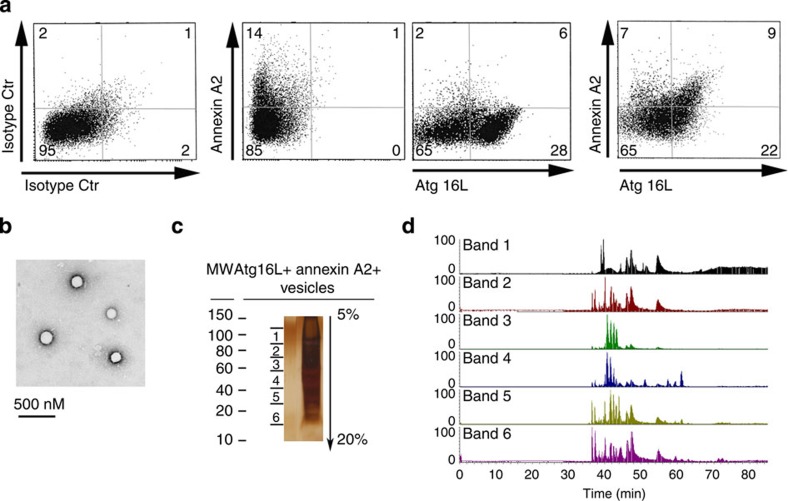
Figure 2. Proteomic characterization of Annexin A2+/Atg16+ vesicles.
(a) FACS analysis of annexin A2+ and Atg16L+ vesicles (n=14 sorts). (b) Ultrastructural analysis of annexin A2+/Atg16L+-sorted vesicles. (c) Silver staining of an SDS–PAGE gel loaded with lysates of annexin A2+/Atg16L+-sorted vesicles. The gel was divided into six bands for mass spectrometric analysis. (d) Chromatogram of each gel band following protein extraction and trypsin digestion. Proteins identified by mass spectrometric analysis are listed in Table 1. Data presented in c,d are representative of three separate experiments.

