
Fig. 2.
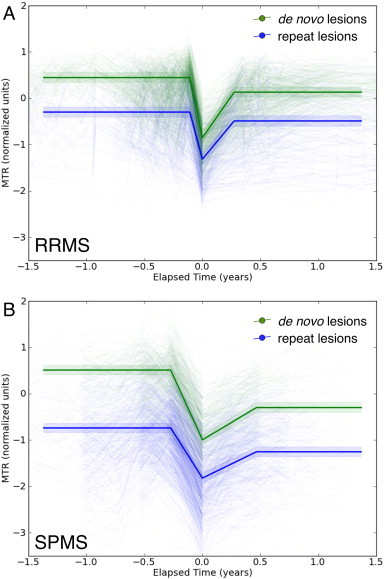
MTR timecourses in de novo (green) and repeat (blue) ∆MTR lesions from subjects with RRMS (A) and SPMS (B). All lesions showed characteristic timecourses with MTR decreasing at the time of lesion formation (time 0), then recovering partially afterward. Pre-lesion MTR values in repeat lesions were similar, though lower, to post-recovery values in de novo lesions. Heavy lines are predictions from the model while light lines are individual lesion timecourses. Shaded areas indicate 95% confidence intervals.