
Fig. 3.
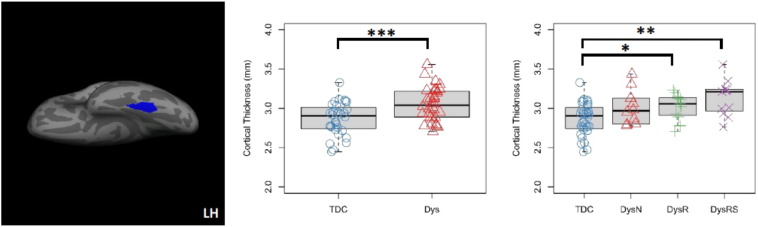
Cortical thickness (CT) increase in the left fusiform gyrus in dyslexia revealed by the masked analysis. Left: cluster in the left fusiform gyrus with significantly thicker cortex in the Dys than the TDC group (centroid MNI: −32, −46, −20, cluster-wise p = .006). Middle: boxplot and stripchart of mean CT of the significant cluster in the two group comparison. Right: boxplot and stripchart of mean CT of the significant cluster in the TDC and the three dyslexia subgroups. TDC = typically developing children, Dys = dyslexia, Dys-N = dyslexia with no remediation, Dys-R = dyslexia with reading remediation, Dys-RS = dyslexia with reading and spelling remediation, LH = left hemisphere. ***p < .001, **p < .01, *p < .05.