
Fig. 5.
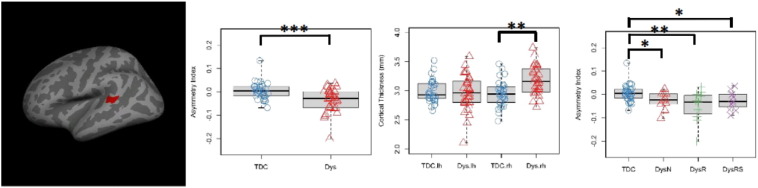
Lateralization findings in the masked analysis. Left: cluster in the superior temporal gyrus that exhibited significantly more rightward lateralization in the Dys than the TDC group (centroid MNI: 60, −36, 9, cluster-wise p = .025). Middle left: boxplot and stripchart of mean AI values for the significant cluster in the two group comparison. The TDC group showed symmetrical pattern while the Dys group was rightward asymmetrical. Middle right: boxplot and stripchart of mean cortical thickness (CT) of the significant cluster. Mean CT was comparable in the two groups in the left hemisphere, while larger in the Dys group in the right hemisphere. Right: boxplot and stripchart of mean AI of the significant cluster in the TDC and the three dyslexia subgroups. AI = asymmetry index, TDC = typically developing children, Dys = dyslexia, Dys-N = dyslexia with no remediation, Dys-R = dyslexia with reading remediation, Dys-RS = dyslexia with reading and spelling remediation. ***p < .001, **p < .01, *p < .05.