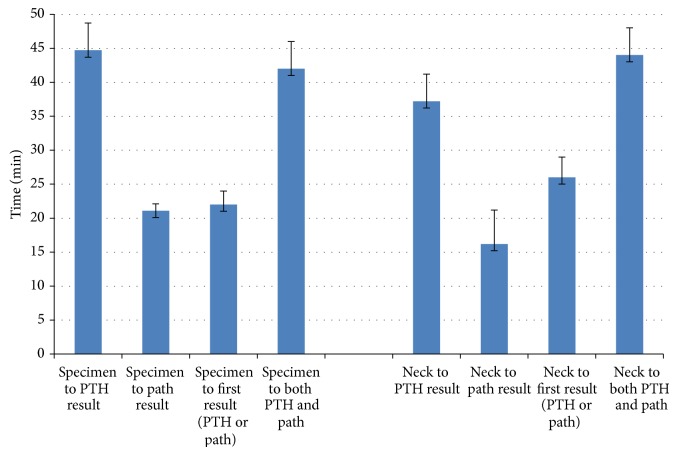
Figure 5.
Graphic representation of time saving using specimen and neck imaging compared to path and/or PTH confirmation. Values represent mean of all specimens removed with error bars representing standard error of the mean. Specimen to PTH result: time from the beginning of specimen imaging to IOPTH results. Specimen to path result: time from the beginning of specimen imaging to time of pathology results. Specimen to first result (PTH or path): time from the start of specimen imaging to whichever result was reported first path or PTH. Specimen to both PTH and path: time from the beginning of specimen imaging until both PTH and path results were reported. Neck to PTH result: time from the beginning of neck imaging to IOPTH results. Neck to path result: time from the beginning of neck imaging to time of pathology results. Neck to first result (PTH or path): time from the start of neck imaging to whichever result was reported first path or PTH. Neck to both PTH and path: time from the beginning of neck imaging until both PTH and path results were reported.

