Figure 1.

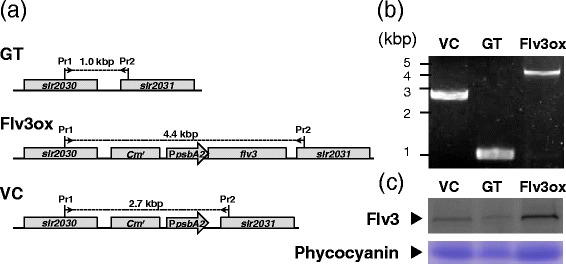
Molecular characterization of the parental (GT), flv3 -overexpressing (Flv3ox), and vector control (VC) strains. (a) Genome structure around integration site in glucose-tolerant (GT), Flv3ox, and vector control (VC) strains. Pr1 and Pr2 indicate the positions of the primer used for the PCR screening. Cm r, chloramphenicol resistance cassette; PpsbA2, psbA2 promoter. (b) Genomic PCR analysis of GT, Flv3, and VC strains using Pr1 and Pr2. (c) Immunoblot analysis of Flv3 protein in GT, Flv3ox, and VC cells. Total soluble protein extracted from 1.6 mg DCW Synechocystis cells was reacted with anti-Flv3 antibody after separation on SDS-polyacrylamide gel. Phycocyanin was detected by staining with Coomassie brilliant blue. The amount of protein loaded on the gel is 75 μg (GT), 63 μg (Flv3ox), and 70 μg (VC).
