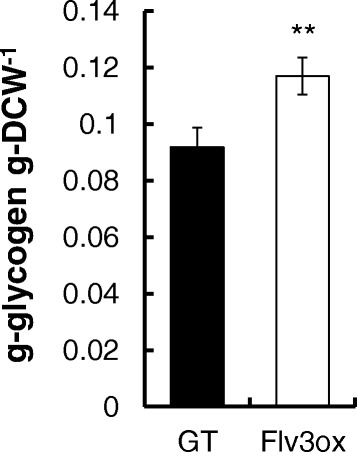
Figure 3.

Glycogen content in GT and Flv3ox cultivated under 120 μmol photons m -2 s -1 light intensity and 1% CO 2 conditions. The values are the mean ± SD of six different measurements. Statistical significance was determined using the Student’s t-test (** P < 0.01).
