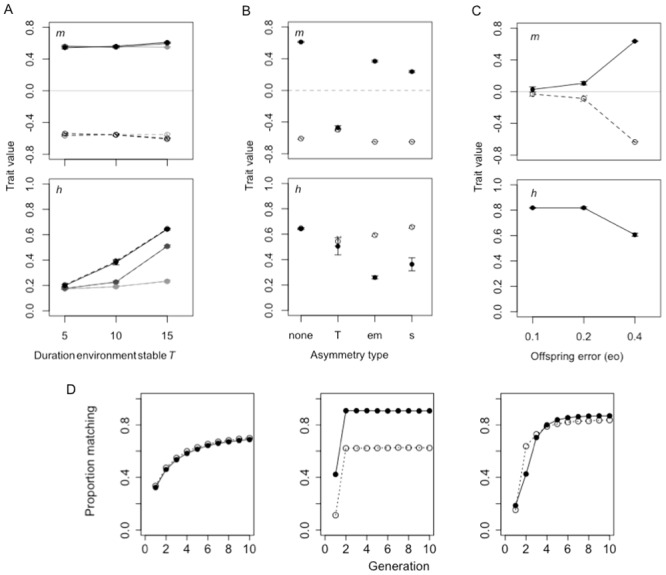
Figure 5. Locust model results.

(A-C) Evolved values (mean±SE from last 20,000 generations) for, top panel, maternal environment effects m (filled circles and solid lines denote crowded environment, hollow circles and dotted lines denote uncrowded environment) and, bottom panel, phenotype-specific transmission stability h (filled circles and solid lines represent gregarious phenotype, hollow circles and dotted lines, solitary phenotype). (A) Separate values are shown for increasing levels of maternal error (pale grey = 0.1, dark grey = 0.2, black = 0.4). (B) Labels on x-axis explain asymmetries considered, i.e. T = (15,5); em = (0.4,0.1) and s = (0.2,0.1) for (uncrowded, crowded) environments respectively. (D) Example of how to measure the hysteresis effect: proportion of matched phenotypes in the population (from one simulation run) for 15 generations following an environmental switch (i.e. duration the environment is stable), when (left) there is no asymmetry in maternal error, i.e. em = (0.4,0.4), (centre) there is asymmetry in maternal error only (em = (0.4,0.1)) but transmission stability is fixed at zero and (right) there is both asymmetry in maternal error and transmission stability.
