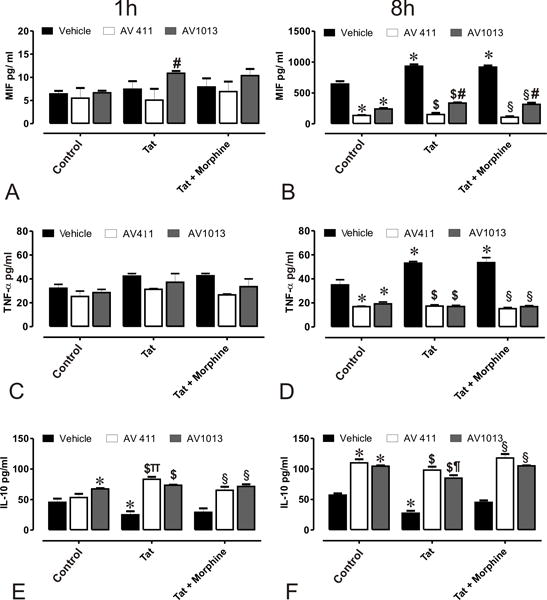
Figure 3. Effects of AV411 and AV1013 on Tat ± morphine –induced inflammatory responses in mixed glial cultures.

Supernatants from cells treated with control media, or medium with Tat ± Morphine with and without 1 μM AV411 and 100 nM AV1013 were used to detect MIF after 1 h (A) and 8 h (B); TNF-α after 1 h (C) and 8 h (D); and IL-10 after 1h (E) and 8h (F) by ELISA. One-way ANOVA followed by Bonferroni’s test for multiple comparisons was used to assess statistical differences. Values are determined from standard curves and given as the mean ± the SEM of 3 experiments. *p<0.05 vs. control; $p<0.05 vs. Tat; §p<0.05 vs. Tat + Morphine; πp<0.05 vs. AV411; ¶p<0.05 vs. AV1013.
