
Fig. 4.10.
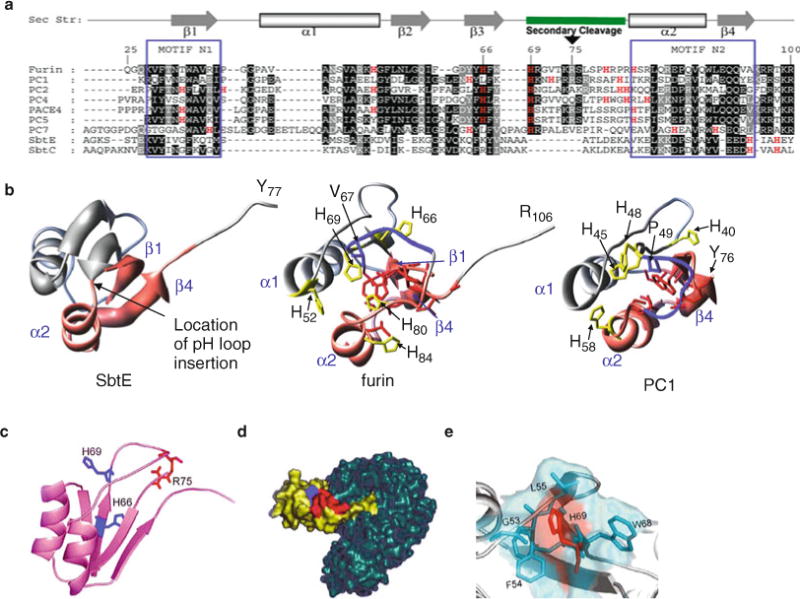
A comparison between the IMC domains of various PCs with their bacterial counterparts. (a) Sequence alignment of the IMC domains of various PCs with bacterial SbtE and SbtBPN. Residues are numbered in reference to the furin IMC, which begins at Gln25. The secondary structure cartoon depicted above the alignment is based on the NMR structure of the IMC domain of PC1/3 (1kn6) (114) and the IMC domain of SbtE (1scj) (76). The pH-sensitive cleavage site loop contains secondary cleavage sites for furin and PC1. Motifs N1 and N2 are well conserved when compared with the rest of the protein (38) and represent the folding nucleation sites in SbtE (75). (b) Pink ribbons in the structures of SbtE, furin, and the IMC domain of PC1/3 depict the relative locations of motifs N1 and N2 mapped on the 3D structure of the IMC domain. The secondary cleavage site is also depicted by the blue tube structure. Histidine residues in the alignment are marked in red typeface and are depicted in the individual structures as well. (c) Ribbon representation of the IMC domain of furin obtained by homology modeling. His66 and His69 (blue) and Arg75 (red) are highlighted. (d) Surface representation of the propeptide–furin complex. The modeled furin IMC (yellow) is docked onto the active site of furin (blue). The internal IMC cleavage site (red) and His69 (blue) are highlighted. (e) Surface representation of the secondary cleavage site illustrates His69 (red) buried in the solvent-accessible pocket formed by Gly53, Phe54, Leu55, Phe67, and Trp68 hydrophobic residues (blue).