
Figure 5.
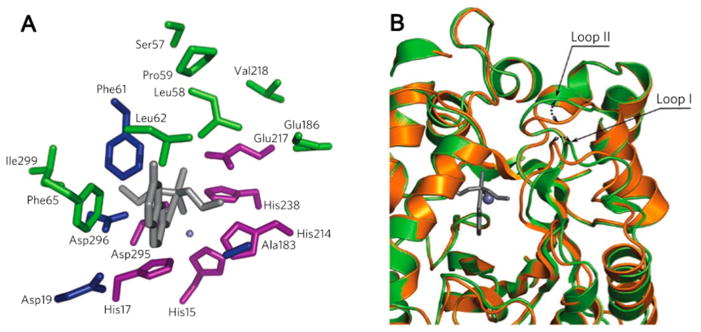
(A) Spatial clustering of WT and activity-enhancing residues in a Zn(II)-containing mouse adenosine deaminase. Residues in which computationally designed simultaneous substitutions were essential for the emergence of organophosphate hydrolysis activity are highlighted in blue. Deaminase residues retained in the most active variant of PT3 (purple), and positions in which activity-enhancing mutations occur during directed evolution (green) form two separate spatial clusters. Residue side chain identities are from the deaminase crystal structure (PDB code: 1A4L), and the transition state model is shown in gray sticks. (B) Superposition of the PT3.1 design model (gold) and the crystal structure (green, PDB code: 3T1G) shows that, although the overall backbone similarity is high (backbone rms deviation = 0.65 Å), there are small shifts in two active site-proximal loops. Reproduced with permission from ref 204. Copyright 2012 Nature Publishing Group.