Figure 1.

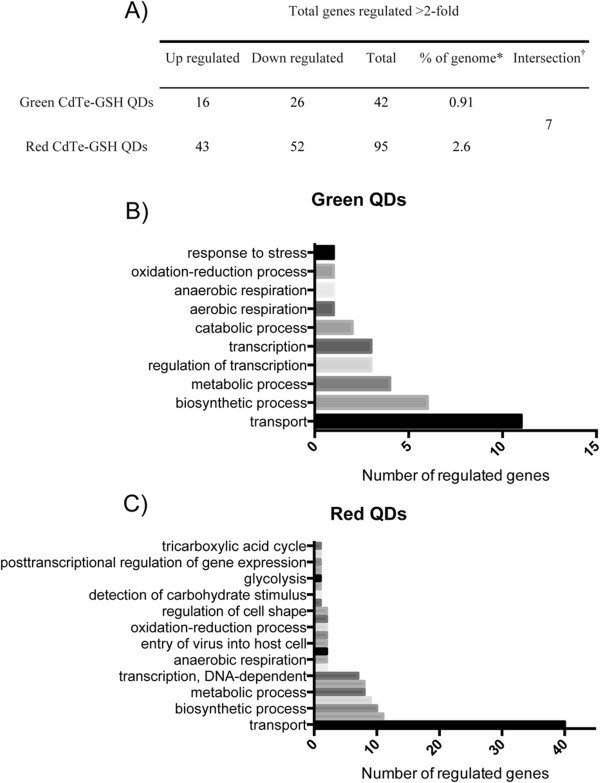
Gene regulation in E. coli exposed to green or red QDs. (A) Summary of total genes regulated in response to green, red and both QDs. Bar charts showing the number of regulated genes sharing specific Gene Ontology (GO) terms after red (B) and green QDs (C) treatment.*Whole genome reference set containing 4 619 E. coli genes. †Genes found in both treatments.
