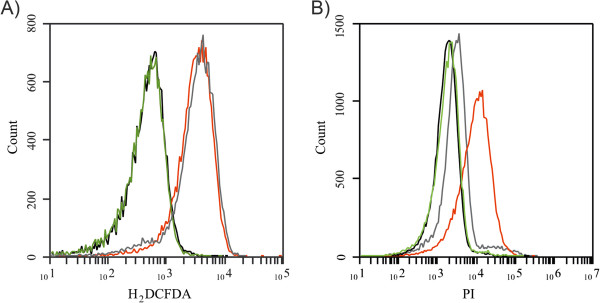
Figure 2.

QDs-mediated ROS production and membrane damage in E. coli . (A) H2DCFDA-FACS histogram for ROS detection and (B) PI-FACS histogram for membrane damage detection. Cells were treated with green (green line) or red (red line) QDs during 30 min. Black and grey lines represent non-treated cells and cells exposed to 50 mM H2O2 (positive control), respectively. Results shown are representative of three independent experiments.
