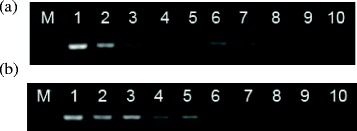
Figure 2.

Evaluation of the sensitivities of nanoPCR (a) and conventional PCR (b) for the detection of MEV NS1 plasmid DNA. Lane M: Low DNA Mass Ladder (Invitrogen, Carlsbad, USA); lanes 1–9: different MEV NS1 plasmid DNA copies subjected to nanoPCR and conventional PCR (8.75 × 10⁸, 8.75 × 10⁷, 8.75 × 10⁶, 8.75 × 10⁵, 8.75 × 10⁴, 8.75 × 10³, 8.75 × 10², 8.75 × 101, and 8.75 × 100 copies/μL, respectively); lane 10: blank.
