
Figure 4.
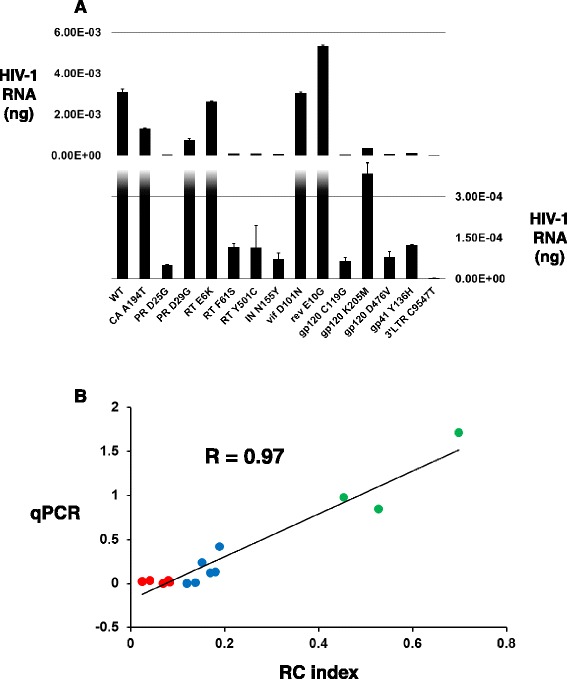
Validation of the HIV-1 qHRG missense mutational profile. (A) Virion RNA amounts in nanogram for WT and each viral mutant following CEM T-lymphocyte infection quantified by qPCR. Split histogram shown with average amount of ng RNA from two separate replicates provided on vertical right axis for lower panel, and vertical left axis for upper panel. HIV-1 mutant identity is given on x-axis. (B) Correlation between the profile RC index (x-axis) and the qPCR results [ng mutant RNA]/[ng WT RNA] (y-axis) of individual HIV-1 mutants showing a very high Pearson’s correlation of R = 0.97. Data points are colored according to profile phenotype: tolerated: green, attenuated: blue, and lethal: red.