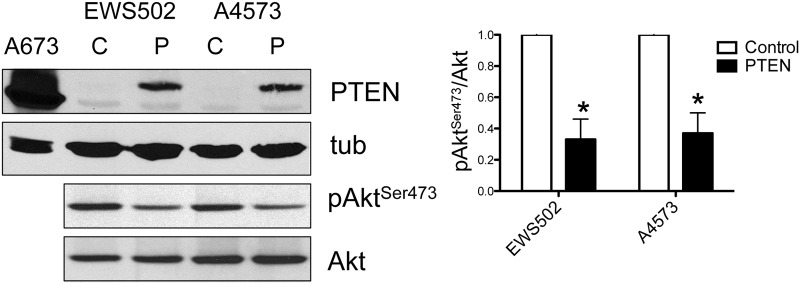
Figure 5. Re-expression of PTEN in PTEN-negative Ewing Sarcoma cell lines.

PTEN re-expression was achieved using a stable lentiviral expression system, and verified by immunoblotting with tubulin as loading control (C: control cells stably transduced with empty expression vector; P: cells stably transduced with PTEN expression construct; for reference, levels of endogenous PTEN in A673 cells are shown in the same blot). Consequences of PTEN re-expression on Akt phosphorylation (Ser473) are shown below, with quantification of pAktSer473/Akt ratios from independent experiments shown on right (mean and standard deviation; values in control cells set to 1; *p<0.05, relative to control, using the student t-test).
