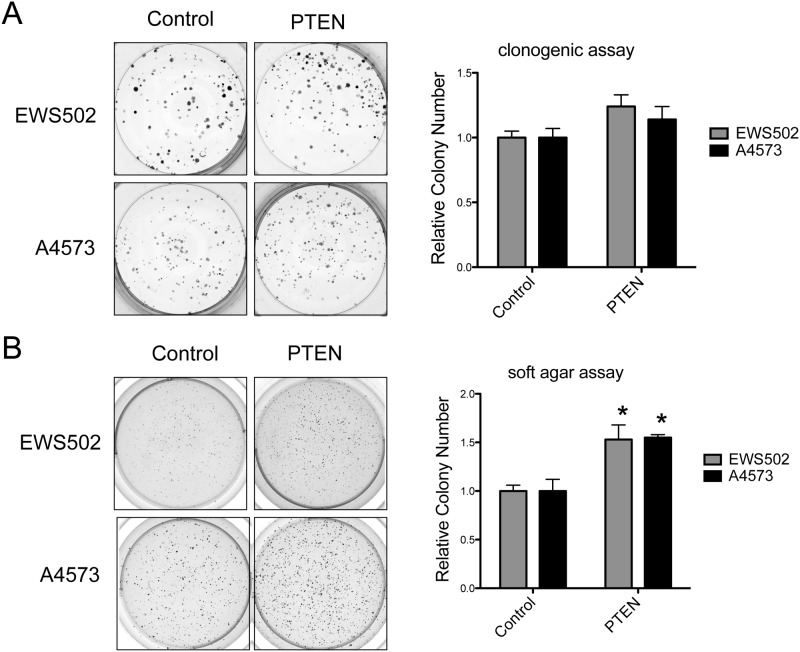
Figure 6. Effects of PTEN re-expression on clonogenic and anchorage-independent growth of PTEN-negative Ewing Sarcoma cell lines.
Clonogenic and soft agar assays of anchorage-independent growth were performed as previously described [19]. Individual experiments were performed in triplicate, with 500 cells/well plated for clonogenic assays and 1 × 10⁴ cells/well for soft agar assays. Experiments were independently repeated with de novo lentivirally transduced cells. Representative images of individual wells from one experiment are shown. Quantifications represent the mean and standard error of the mean (SEM) of colony counts from independent experiments, each performed in triplicate (colony numbers in controls are set to 1; *: p<0.05, using the student t-test).

