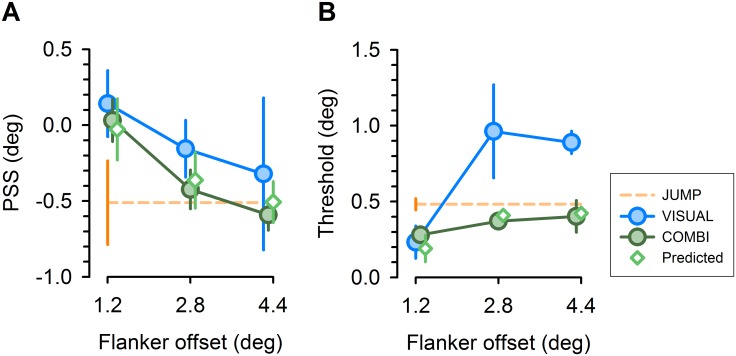
Figure 3. Group average perceptual performance, shown for PSS (left panel) and threshold estimates (right panel) of fitted psychometric functions, respectively.
Diamonds represent predictions for COMBI condition, as expected from average estimates in single cue conditions. Error bars represent within-subject standard errors of mean [50]. Data points for different conditions are shown with small horizontal offsets to increase visibility.

