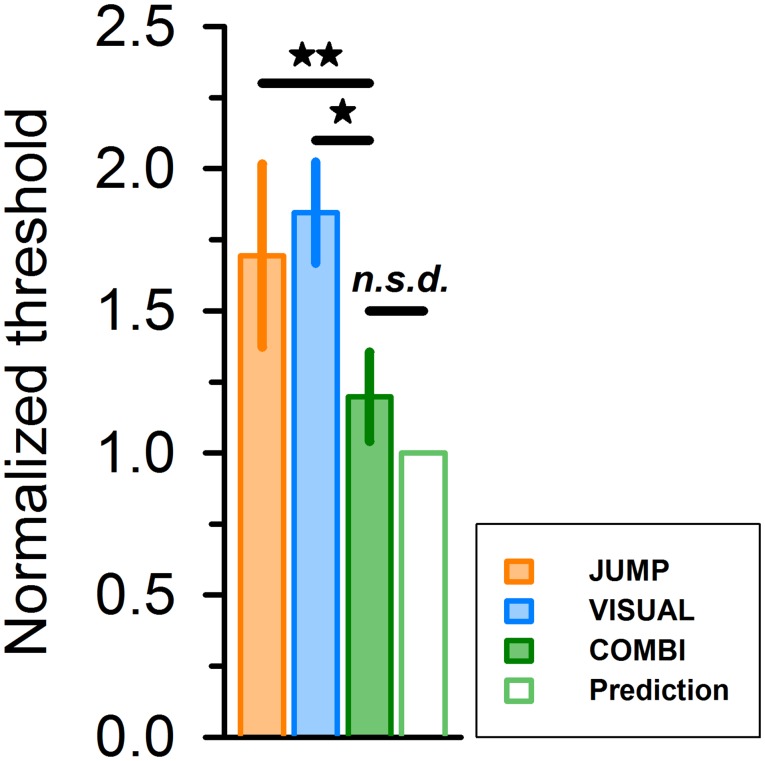
Figure 5. Average group thresholds for different conditions, after normalizing to unity for the predicted value (unfilled green bar to right).
Error bars represent standard error of the mean. Statistical comparison yielded significant differences for COMBI vs. JUMP and COMBI vs. VISUAL, but no significant difference for COMBI vs. predicted thresholds (two-tailed pairwise t-test on non-normalized data, * P < 0.05; ** P = 0.01).

