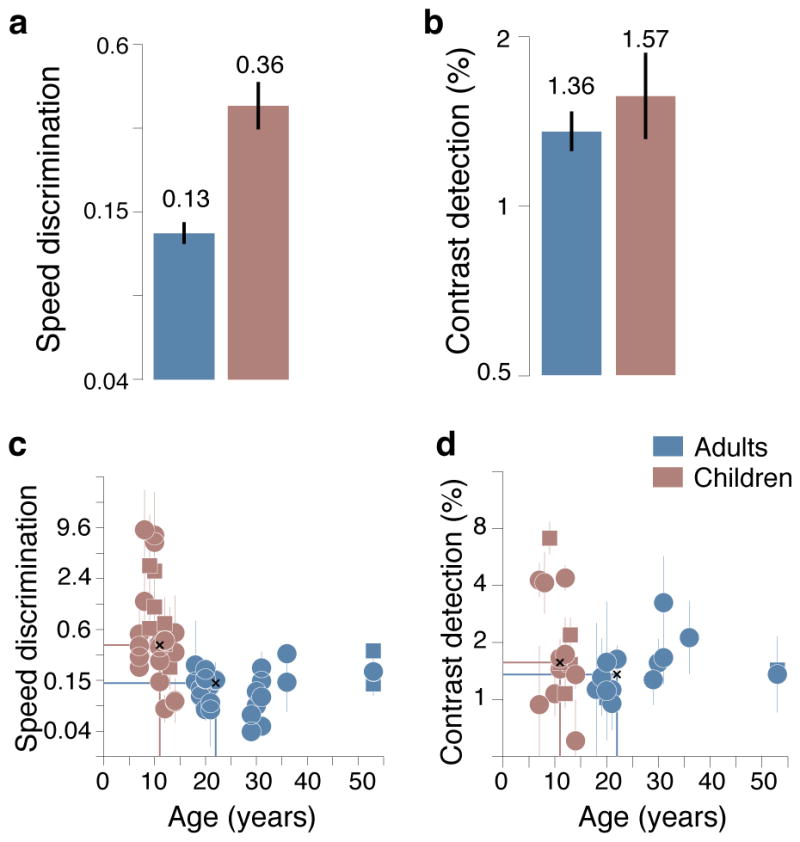
Figure 2. Speed discrimination and contrast detection thresholds.

a and b. Bar graphs of speed discrimination and contrast detection thresholds. a. Median ± SEM speed discrimination thresholds (Weber fraction) in adults and children. b. Median ± SEM contrast detection thresholds (%) in adults and children. c and d. Scatter plots of participants’ age and the psychophysical thresholds. c. Speed discrimination thresholds ±1SD. d. Contrast detection thresholds ±1SD. For speed discrimination, two thresholds were measured for each participant with gratings of slightly different contrast (16 and 24%). Intersecting blue and red lines mark mean values for each group of participants.
Adults = Blue. Children = Red.
Circles = Normal Readers. Squares = Developmental Dyslexia
