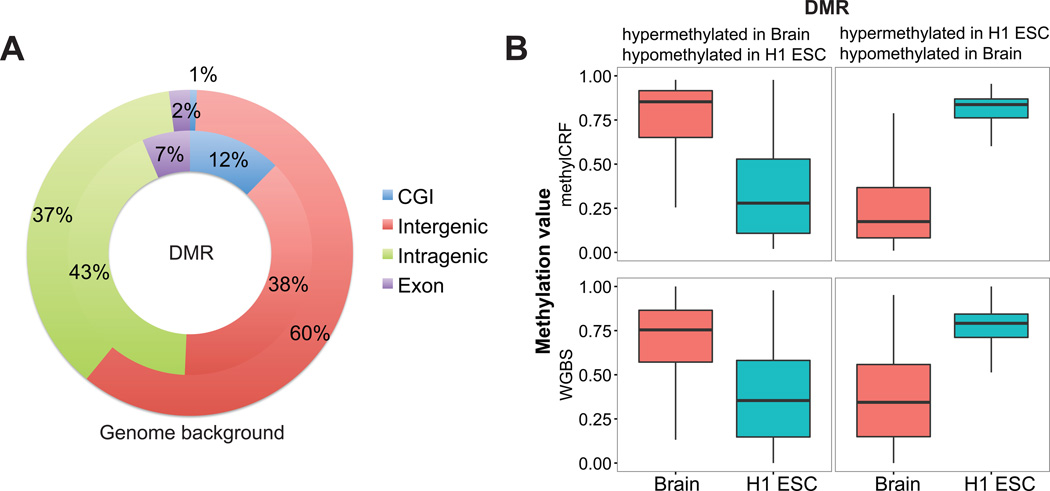
Figure 7. Genome-wide distribution and comparison of DMRs.
(A) A pie chart of locational analysis of DMRs between H1 ESC and brain. The outer pie represented genome-wide background. The inner pie represented distribution of DMRs. The majority of the DMRs were located in intergenic and intragenic regions. Only a small fraction overlapped with CpG islands, although they were enriched. (B) Distribution of DNA methylation levels of predicted DMRs. DMRs were grouped based on their hyper- or hypo-methylated status predicted by M&M. DNA methylation levels predicted by methylCRF (upper panel) and by WGBS (lower panel) were both plotted.

