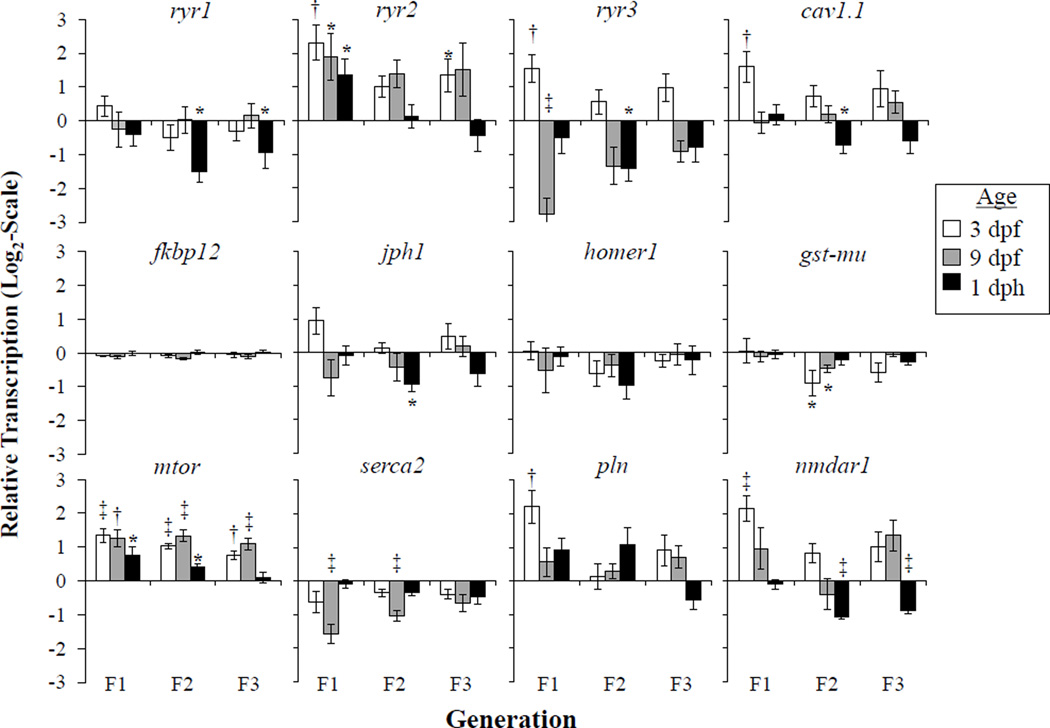
Figure 3.
RyR related mRNA differences between SC and NBH embryos and larvae from various developmental stages across multiple generations. Data shown is relative to the transcript levels observed at the same age class for SC (0 on the y-axis). Means ± SEM; n≥6; * p ≤ 0.05, † p ≤ 0.01, ‡ p ≤ 0.001. Abbreviations see Table 1.

